Extracted from: May, 1970, Sky and Telescope, Page 318 & ff.
GLEANINGS FOR ATM’s
CONDUCTED BY ROBERT E. COX
A Slitless Spectrograph for the Flash Spectrum
IN 1963, after having read S. A. Mitchell’s exciting book on solar eclipses [1], I became especially interested in his detailed descriptions of the flash spectrum of the sun’s chromosphere, which is observed for a few seconds at the beginning and ending of totality. I constructed a small concave-grating spectrograph and took it to that year’s eclipse at Stetson, Maine. But the equipment was never used, for the very thin crescent of the sun dissolved in clouds five seconds before the second contact.
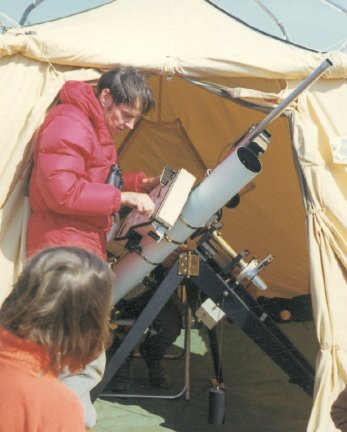
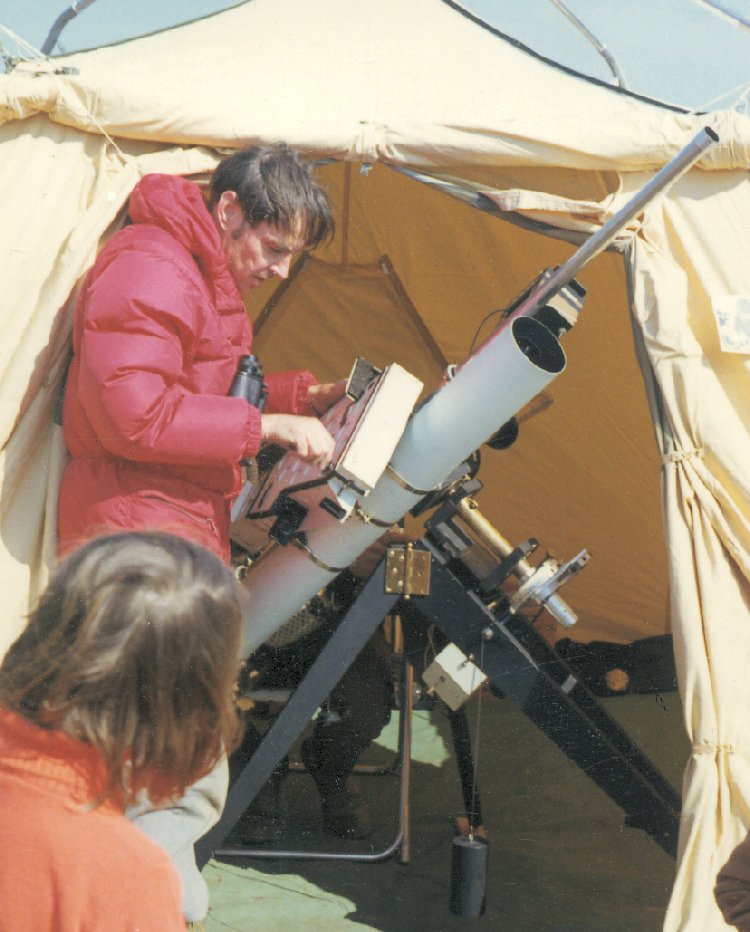
This year [1970] I tried again, taking the spectrograph mounted on my 4-1/4-inch f/28 reflector to Nantucket Island. Spectra were obtained at second contact, at mid-totality, and at third contact, the last being shown in color, four-times enlarged, in the center of this issue. A good flash spectrum is not only colorful but very informative scientifically – an important means for studying the composition and physical properties at different levels in the sun’s atmosphere.
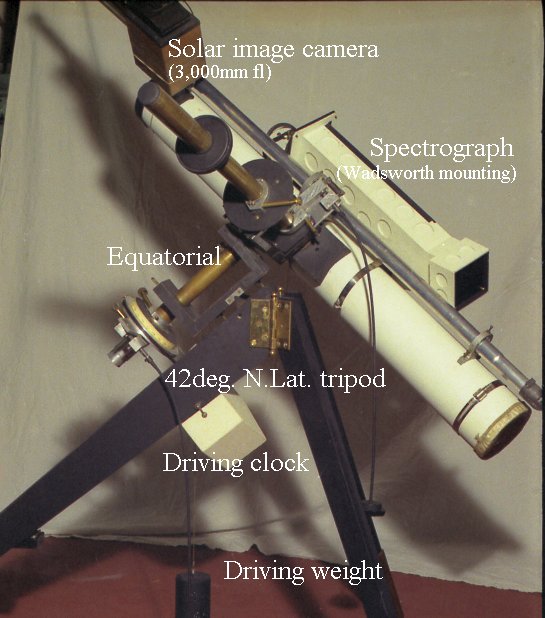
What I needed was a compact instrument that could be attached to a portable, clock-driven equatorial [4] and pointed directly at the sun, eliminating the need for the coelostat arrangement professionals use for their larger equipment (see, for example, pictures on pages 280 and 284 of this issue). At the same time I sought good spectral resolution and large plate scale, in order to record many lines in the flash spectrum instead of just the few brightest ones revealed by direct-vision spectroscopes.
In Amateur Telescope Making—Book Three, Strathmore [2] R. B. Cooke and Robert A. Wilson give a complete geometrical treatise on the Wadsworth mounting for a five-foot laboratory spectrograph. This compact arrangement includes a collimating paraboloidal mirror and slit, without which the light source would have to be an infinitely distant slit. However, at an eclipse this requirement is essentially met by the thin crescent of the solar chromosphere produced by the advancing moon.
Thus, my spectrograph has the great advantage of only one optical element, the concave (spherical) diffraction grating, which focuses monochromatic images of the chromosphere directly on the strip of 35-mm. film that is held at the parabolic focal surface. The instrument’s size, configuration, and performance are completely determined by the grating constants. Replica gratings are perfectly acceptable for most amateur and laboratory purposes, and are offered by Edmund Scientific Co., Central Scientific Co., and others for less than $100.
I chose Edmund’s “instrument-quality concave grating,” which is made of glass 3″ in diameter that has been optically figured and aluminum coated. Its radius of curvature is 1,000 millimeters, and an area 1-1/2 in square is ruled with 15,000 lines per inch. It forms a solar image about five millimeters (1/5 in) in diameter, which easily fits in the width of 35-mm. film and allows room for coronal images. When the grating arrived, I measured its radius of curvature, finding it 10 mm. longer than advertised; my final design was adjusted for the difference in focal length.
The Specifications
Attention was then turned to the geometry of the Wadsworth mounting. The formula
. nλ = s(sin i + sin θ) (1)
gives the relation between i, the angle of incidence of the light on the grating, and θ, the angle of diffraction, both measured from the normal (perpendicular) to the grating, as shown in the diagram. Also, n is the order of the spectrum (always a whole number), λ the wavelength in centimeters, and s the spacing between the grating lines, in centimeters.
Because a compact instrument giving maximum image brightness was required, I was limited to the use of the first-order spectrum, so that n was fixed as unity.
The dispersion of the spectrum, expressed in angstroms per millimeter along the focal surface, is given by 107 s/nf, where f is the focal length of the grating (half the radius of curvature), or 505 millimeters for my grating. For s, I used 1/590 millimeter, corresponding closely to 1/15,000 inch, which gave the dispersion as 33.6 angstroms per millimeter.
The spectral range that I wanted to cover lay between 3000 angstroms in the ultraviolet and 8000 in the infrared. This would occupy about 150 millimeters or 6″, that is, 3″ on either side of a central wave length of 5500 angstroms in the green region.
To place this central wavelength of the spectrum upon the grating normal, we set θ = 0 in Equation 1, which becomes
. sin i = λ/s. (2)
Expressing- both lengths in millimeters, λ is 5.5 X 10⁻⁴ and s is 1/590. We obtain sin i = 0.3245, and i = 18° 56′.
Using this value of i in Equation 1, we can calculate the values of θ corresponding to 3000 and8000 angstroms. We find that these extremes are symmetrically placed 8° 29′ on either side of 5500 angstroms.
This last calculation is important to be sure that there is enough clearance between the incident rays and the red end of the spectrum to accommodate mechanical and structural elements, such as shutter, film spools and pockets, and the camera walls. For my spectrograph, the clearance is 18° 56′ – 8° 29′ = 10° 27′. Had this been insufficient, I would have set a longer wavelength on the grating normal, obtaining a larger angle of incidence.
The focal curve is not an arc of a circle (a parabola), but is defined by the relation
. D=R cos2 θ/(cos i +cos θ), (3)
where D is the focal distance at the diffraction angle θ, and R is the radius of curvature of the grating. We can lay out the focal curve by calculating D for selected values of θ, preferably employing logarithms for accuracy.
Mechanical Construction
Completion of the calculations permitted me to design the spectrograph itself: a lightproof box with suitable covers, access openings, grating support, and film support. In addition, baffles, screens, and light traps were placed to eliminate spurious reflections and stray light. The entire assembly was painted flat black on the inside.
 The film was supported at its edges by two strips of Masonite 6″ long and 1/8” thick, filed accurately to fit the calculated parabolic curve. The top and bottom runners were cut and filed together, for a perfect match. Slotted holes in the film support brackets permit slight shifts for the focusing adjustment. A film transport arrangement was devised to fit standard 35-mm. cassettes for winding and rewinding with slotted cranks inserted from the outside. The shutter must be large enough to illuminate the grating area fully, with additional clearance for the field of view (2° in this case). Shutters of large aperture are hard to find, but I came across an old 2-1/2” bulb-operated Packard shutter which worked well after cleaning and oiling. The shortest exposure that I can manage with it is about 1/5 second.
At an angle of reflection equal to the angle of incidence, the source produces a bright zero-order image. To absorb this, I made a black-velvet light trap, as shown in the diagram. But the trap can be opened to allow the strong direct image of the sun to fall on a target, thus providing a convenient means for aiming the spectrograph without opening the film plane access door. The grating holder should be rigidly mounted but adjustable, as in the design by Cooke and Wilson. All but the ruled area should be masked to reduce the intensity of the direct image. To preserve the grating surface, it is essential that the grating cell be fitted with an air- and dust-tight cover.
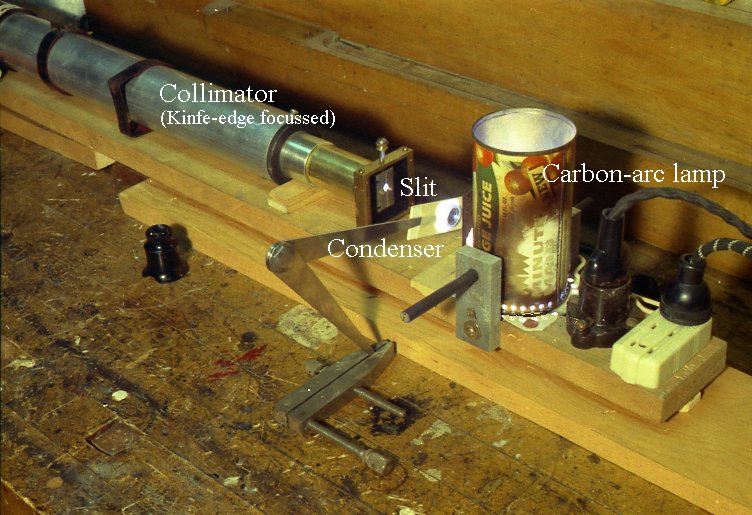
Provision must be made to set the film curve exactly in focus, not only at the center wavelength on the grating normal but at the other wavelengths along the spectrum. This requires, in the workshop, setting up a collimator and a bright, sharp source such as a slit illuminated by an arc. At the focus of a good 2-inch f/20 achromat I put an adjustable slit like one described by John Strong in ATM-3. To be sure the slit was exactly at the focus of the lens, I pointed the telescope at the star Sirius and moved the slit along the optical axis until the objective darkened uniformly as the star drifted past the optical
axis (as in a knife-edge test).


. Disassembled camera Collimator
Then the collimator was aimed at the grating and the slit illuminated by an arc, one carbon of which had been soaked in a mixed salt solution (NaCI, KNO3, or SrNO3). This produced a rash of bright lines all along the visible spectrum. Using a strip of frosted acetate as a ground glass, and setting the slit for best apparent parallelism with the grating rulings, I used a jeweler’s loupe to focus each section of the film curve. That is, I adjusted the film holder for best focus at each point along the spectrum; the sodium D line was easily resolved into its two components (0.2 mm. separation).
Not apparent when focusing with a slit is an astigmatism which is zero on the normal and increases to either side, becoming very noticeable in the zero-order image. It causes the crescent cusps and other eclipse features not essentially parallel with the rulings to appear somewhat out of focus at the ends of the spectrum. Physicists use cylindrical lenses and other means to overcome this astigmatism, but such a refinement is not necessary for the flash spectrum.
Observing the Eclipse
I loaded two 20-exposure 35-mm. cassettes to permit trying out two kinds of film at the same eclipse. The leaders were taped together before loading; after loading and closing the camera the splice and a predetermined length of film were wound into one cassette to draw in an unexposed length of film from the other.
After this exposure the winding was reversed and the splice moved from the first cassette into the second for subsequent exposures on the film thus drawn from the first cassette. I did not use 36-exposure cassettes because these might make this operation difficult. I made sure to return the splice to the grating normal before opening the camera for removal of the cassettes.
I was unable to find a complete record of grating constants, exposure time, and film speed for some previous flash spectrum photograph. The speed of the grating is f/Ae, that is, the focal length divided by the equivalent aperture. The latter is Ae = (4As/π)1/2, where A is the actual grating aperture.
However, this calculation is confused by the fact that only part of the reflected light is concentrated into any given order. My grating has an advertised efficiency of 50 to 75 percent and a blaze wavelength of 4000 angstroms, meaning that 50 to 75 percent of the reflected light is concentrated in the first order and further concentrated locally in the 4000-angstrom region.
I decided to try about twice the exposure times recommended for use with a 40° objective prism [3], since substantially all of the light leaving a prism falls within its only spectrum. The exposures used this year on Nantucket Island were 1/5 second on Ektacolor-S (ASA 100) for the flash spectrum at second contact and 1/3 second on High Speed Ektachrome (ASA 160) at third contact (see center pages). Also, a 1-second exposure was made on Ektacolor-S at mid-eclipse, to record the coronal emission.
Before the eclipse the direction of the moon’s relative path was calculated, in order to orient the instrument so that the rulings would be tangent to the midpoint of the chromospheric crescent; this would produce crescents set vertically along the length of the spectrum. However, at Nantucket we were a substantial distance north of the eclipse’s central line, and the crescents could not be made to appear this way at both contacts.
[My assistant and friend Frank Dow manned the hour-angle and right ascension slow motion adjustments to be sure the sun’s image remained centered by cancelling accumulating errors in the motion of the weight-driven clock.]
Without practice from previous eclipses, and in the excitement of the moment, it is very hard to determine exactly when to operate the shutter. The flash lasts only the few seconds it takes the moon’s limb to traverse the solar chromosphere. I placed a small 5,000-line plane transmission grating (Wabash Instruments and Specialties, Wabash, Indiana) over one objective of a pair of binoculars, oriented so the rulings were perpendicular to the moon’s path.
With this, the Fraunhofer absorption lines (crescents) could be seen darkening and sharpening as the “slit” of the photosphere narrowed in the moments before totality. Fleetingly the crescent cusps gleamed and finally the chromosphere’s bright-line spectrum flashed into view as the bright arc of the photosphere was fully extinguished.
At this moment, the stopwatch was started, to provide a countdown for the recurrence of the flash spectrum at third contact, two minutes later. Of course, with good time-signal reception and an accurate prediction of the duration of totality, second and third contacts could be timed without visual watching, but surely one would not want to trade the beautiful spectacle of the sudden appearance of the flash spectrum for the small cost of a plane transmission grating.
WILLIAM C. ATKINSON (1970)
343 South Ave.
Weston, Mass. 02493
Notes:
[1] Eclipses of the Sun, Samuel Alfred Mitchel, Columbia University Press, New York, Fifth Edition, 1951, 445 pages.
[2] Amateur Telescope Making – Book Three, Edited by Albert G. Ingalls, Scientific American, Inc., 1953, 644 pages.
[3] Solar Eclipse Photography for the Amateur, Eastman Kodak Co., Rochester, New York, Pamphlet No. AM-10, 1968.
[4] In 2017 the spectrograph and equatorial mounting (tripod with clock drive) were donated to Cornell University’s Fuertes Observatory, in Ithaca, NY.